1813 Napoleonic Wars – Minard
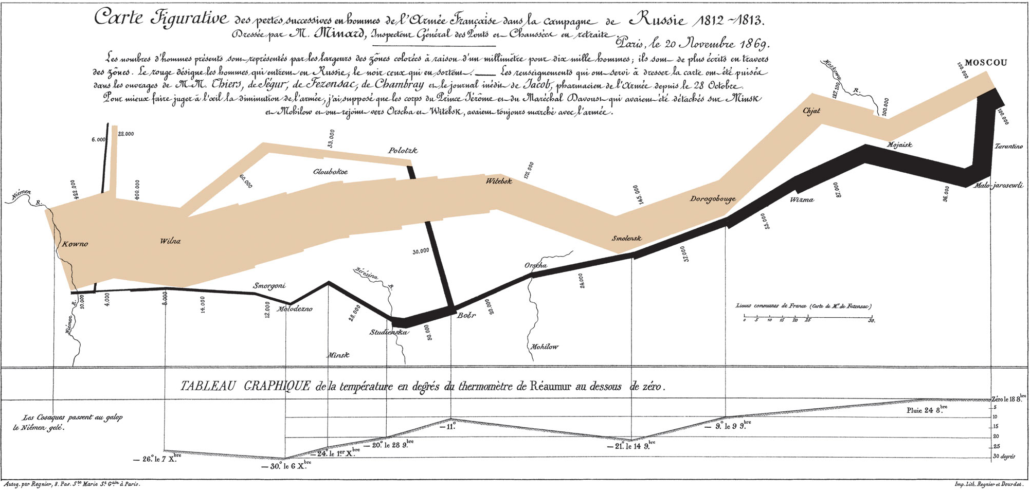
This infographic made by Charles Joseph Minard in 1869 is perhaps the most foundational to the modern field of data visualization. It is one of the earliest examples of a flow map, showing the spectacularly diminishing number of troops in Napoleon’s Grande Armée during his attempt to conquer Russia. Minard had experienced some of the warfare of this period personally and it had deeply affected him. This infographic was designed to show the terrible cost of war to a French public nostalgic for its imperial day in the sun. With clean, spare beauty, this piece eviscerates the Napoleon’s choices, and anyone who had dreamed this gargantum waste of life into glory days.
