While these extreme examples are difficult to contemplate, each region of the interactive has its own monsters, from the Chinese Civil War (63.42 deaths per hour for 9 years), to Ethiopia’s Red Terror (57.08 deaths per hour, over 3 years). In the the Holocaust, Nazis killed approximately 117 people, a vast majority of them Jews, every hour for 11 years. The way this interactive deconstructs and then rebuilds the death tolls we are familiar with is brilliant and devastating.
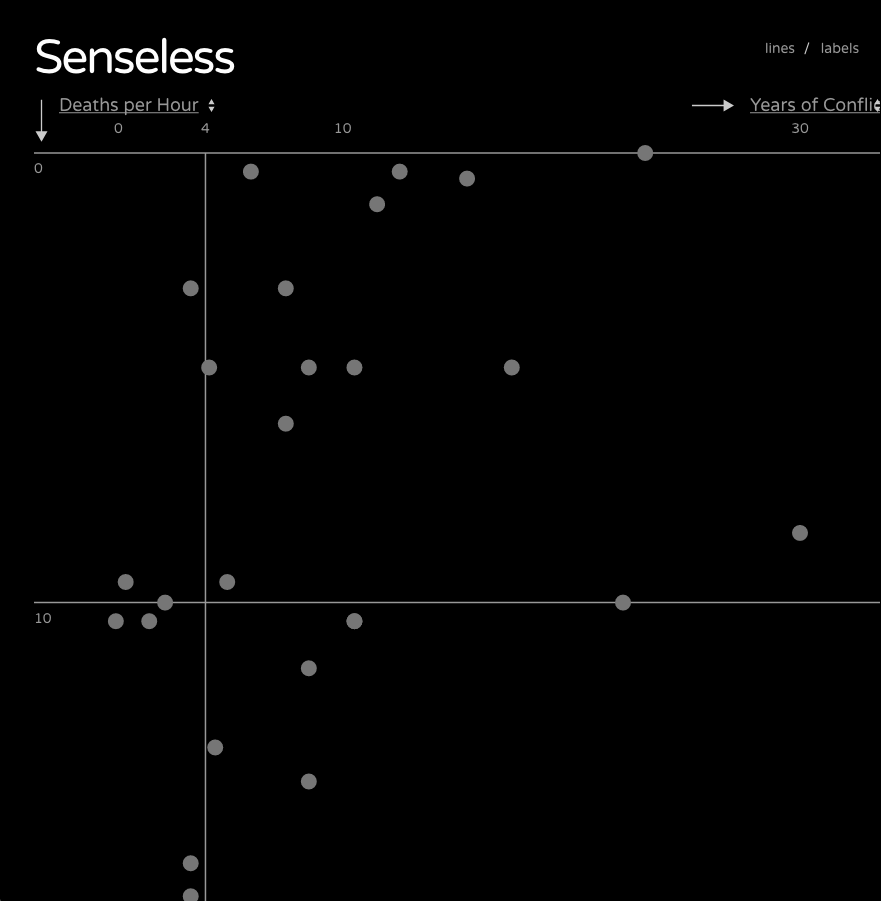
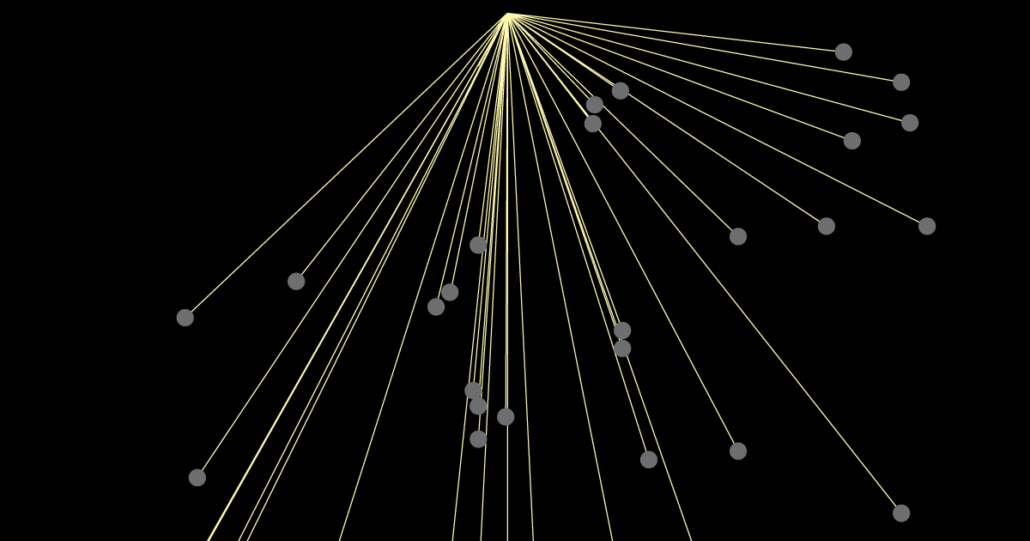
‘Senseless’ could easily have been made as a line or bar graph, scatter plot, or conventional timeline. It’s hybrid construction is far more attractive and interesting. Without directly referencing war in any way, the yellow lines, fanning out to the conflict points against the sober black background, are striking. By having their anchor point at the top, they lead the viewer into the numbers and the tragedy but also create movement, and guide the user from one conflict to another across the screen. Instead of one horizontal timeline, the lines create the feel of individual timelines, allowing the user to focus in on one conflict and its repercussions at a time without getting lost in the large dataset. This is vital for keeping users engaged and learning, without the nature of the data totally overwhelming them emotionally. This interactive is deeply poignant but not morbid, largely thanks to this strategic structure.
The design of ‘Senseless’ feels clean and technical, but the rays of yellow and their contextual contrast add a familiar character and dimension. Particularly when the labels are clicked off, the lines look like sunbeams. To some though they may recall haloes from Buddhist imagery, or the rays showing the Holy Spirit in Christian iconography to others. With such a dark and global subject, this potential spiritual reference does not seem out of place. Even if this jolt of yellow- with all its optimistic associations- was simply intended to lift the piece out of total hopelessness, it was an effective and affecting choice on McCandless’s part.
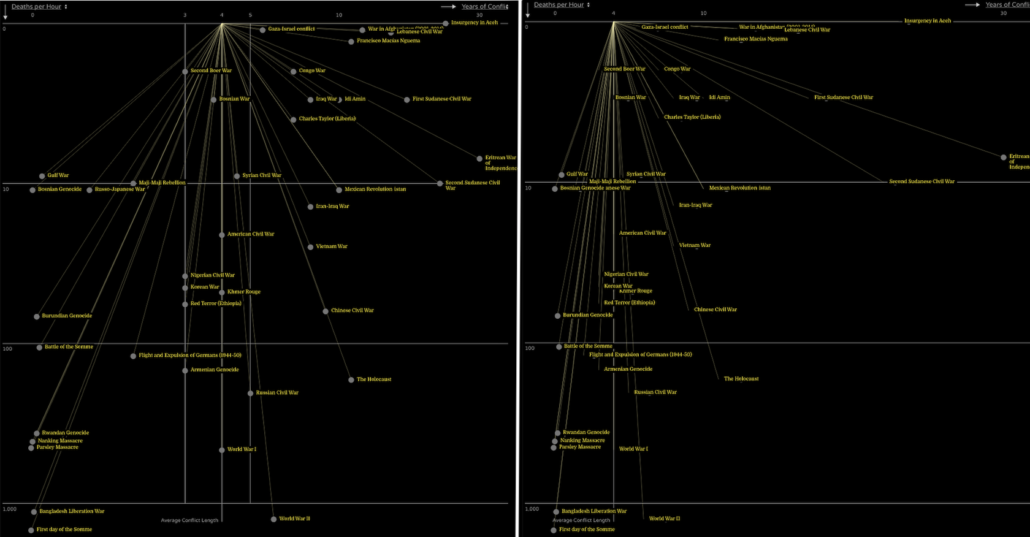
It is important to note that the default display of these lines and the conflicts they connect to is based on a logarithmic scale, not a linear one. This is not infrequent in high volume data visualizations, but for true understanding of the data it is better to look at it on a linear scale. This can be done by clicking on the “Years of Conflict (Log)” on the top left of the interactive and changing it to linear. If this option is not visible, the interactive must be dragged out horizontally to see it. Four years is the connective baseline from which all the lines start in both versions, and this is a relatively good compromise among the year lengths, ignoring the outliers; these outliers were probably the motivation for making the logarithmic scale in the first place.
‘Senseless’ is not a clearcut tool for analysis. It has a perspective on the figures it presents, and the structure of the interactive represents and reinforces this. The violence and bloodshed is condemned as “senseless” by the title. However, there is very little in the way of narrative beyond this title. Each conflict is given a brief explanation when it is hovered over, which is very useful considering how obscure some of them are. The only other framing though is offered outside of the actual interactive, on the page it is housed on: “Some of the most brutal and senseless conflicts go unseen and unremembered. Yet many give cause & context for modern events.” As eloquent as the title is, it would have been worthwhile to have included more of an explanation or description than this.
This write-up contextualizes the name of the piece without having a ton to do with the interactive itself. ‘Senseless’ is not about connectivity or causality, but about comparison. The sentiment is laudable, but the power of this piece is elsewhere. Deaths per hour is a new number which has rarely been calculated; it is a new way to feel the weight of war, the pace of the body count, and a more personal value of time in relation to loss. Recognizing some of this intention in the body of the interactive would have done ‘Senseless’ more justice.
The creators do appreciate how important these numbers are though, and also how interested people might be in them. Linked below the interactive is an accessible, sortable copy of the Google spreadsheet used to populate ‘Senseless.’ This would have been an incredible tool in itself- the amount of research contained within it is substantial and goes far beyond the scope of ‘Senseless.’ Paired with the interactive, it is invaluable for historical research and understanding.
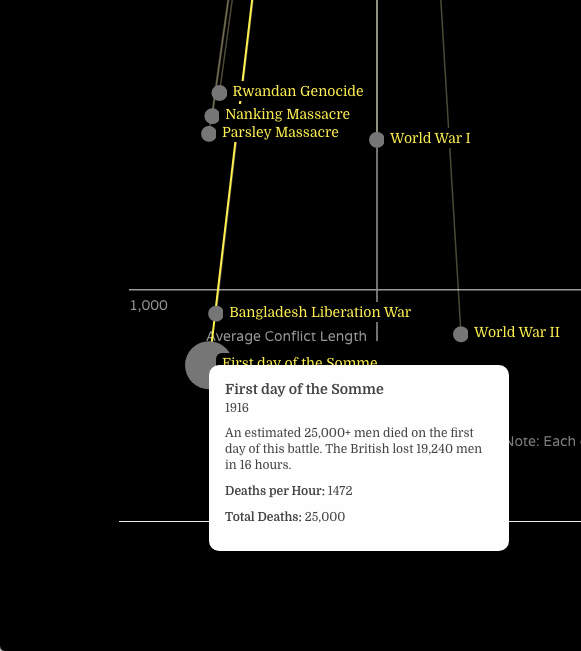
While it is attractive, functional, and intuitive, there are several ways ‘Senseless’ could be improved. A search function would be useful to allow users to find particular conflicts given that they are sorted by an unfamiliar variable. Also a visual distinction between wars and events would meet with Tufte’s approval, as generalizing them all as conflicts misses important distinctions in the historical data. There is also a low amount of mishandled data along these lines. The first day of the Somme (deaths per hour 1,472), the Battle of the Somme (deaths per hour 106), and World War I (deaths per hour 464) are all represented with equal standing, as though they were entirely separate events. In reality, the numbers for the first day are folded into the battle, which is folded into the war. Separating them without some explanation misrepresents their interdependence and interferes with the type of direct comparison that this interactive is supposed to facilitate.
Including dates in the hover would add context, as well as dispel any confusion and clarify the connections between different points. Label overlapping is another issue, especially when the interactive is compressed. Finally, McCandless could have forgone the uniform grey dots and shown the total deaths for a given conflict through these points. For example, the death rate might have been visualized through the size of point, or a variegated color scale could have been applied to them.
These flaws are not fatal ones by any means, but for interactives that are designed to be more tool than message, oversights that slightly diminish efficacy also lower the perceived professionalism of the work. Even so, they don’t compromise the meaning and true value of ‘Senseless.’
The virtues and flaws of ‘Senseless’ take on an interesting dimension because McCandless is the founder of the company Information is Beautiful. The website is entirely dedicated to data visualizations. Information is Beautiful partners with the company Kantar to produce the Information is Beautiful Awards. These data visualization awards have been given to multiple other pieces profiled on The Art of Consequences, including ‘Poppy Field’ and ‘The Fallen of World War II.’ Neil Halloran, the creator of the latter, has also received attention from the awards for his sequel project, ‘The Shadow Peace.’
McCandless loves data visualization with an all-encompassing and prolific passion. He has created an average of 1.7 visualizations per week for the last 5 years and has made over 600, most of which are hosted on Information is Beautiful. Many of them are self-motivated, but some were made to accompany articles. McCandless started out in journalism, and through Information is Beautiful he still worked closely and frequently with The Guardian until 2014, and has also worked with Die Zeit and Wired.
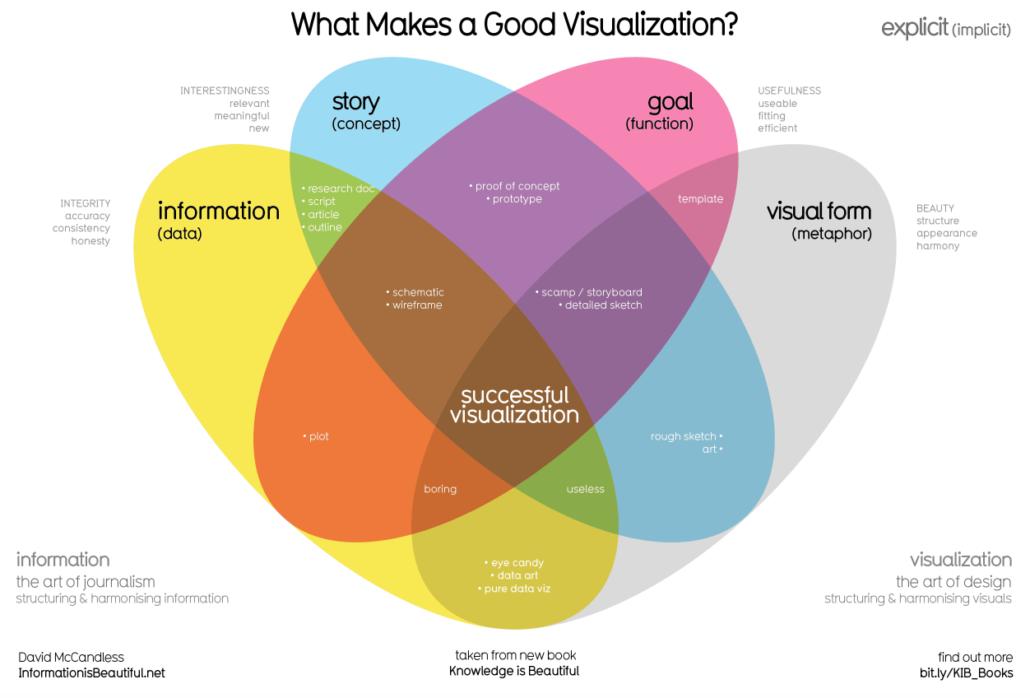
Whatever their purpose, not all his visualizations are hits, but many of them are fascinating and extremely well-executed, ranging from ‘Senseless’ to ‘The Microbe-scope,’ ‘The Hollywood In$ider,’ and ‘Based on a True True Story?’- these three are particularly worth a look. War is obviously not his only subject, or even a common one for him, but he seems to attack each new topic with this passion, and to a certain extent tailors his style to match it. He has even made a visualization about good data visualizations, which overlaps with many of Tufte’s theories.
David McCandless conceptualized and designed ‘Senseless’ but he collaborated with several other people to bring it to life. On the interactive, Miriam Quick is credited for research. Interestingly, she also worked with ‘Poppy Field’ creator Valentina D’Efilippo on another of her projects. Quick has an excellent, Tufte-based approach to data visualization research and this shows in her data for this project and also in the way she writes about her work. Fabio Bergamaschi developed the interaction design and code. Bergamaschi is also a designer and has been working with McCandless through Information is Beautiful for at least four years, and also collaborated with him on his first of several books about data visualizations. If the result is anything to go by, the three of them worked well together.
‘Senseless’ is not flashy enough to have received a tremendous amount of notice or acclaim online, and it does not seem to be a huge priority in the mammoth scope of its creator’s data visualization endeavors. It is not defined by stunning illustrations, meticulously crafted animation or even an airtight data framework. The piece is still beautiful, effective, and utterly remarkable. McCandless found a way to impart meaning to conflict figures by adding yet more numbers to them. In so doing he created a personal, relatable and uniquely poignant metric through which users can see and feel the “senseless” bloodshed of the past century.