This timeline highlights innovative + notable war visualizations.
Wars are organized by end date; most are from the 20th century, but other periods are also represented.
1813 Napoleonic Wars – Minard
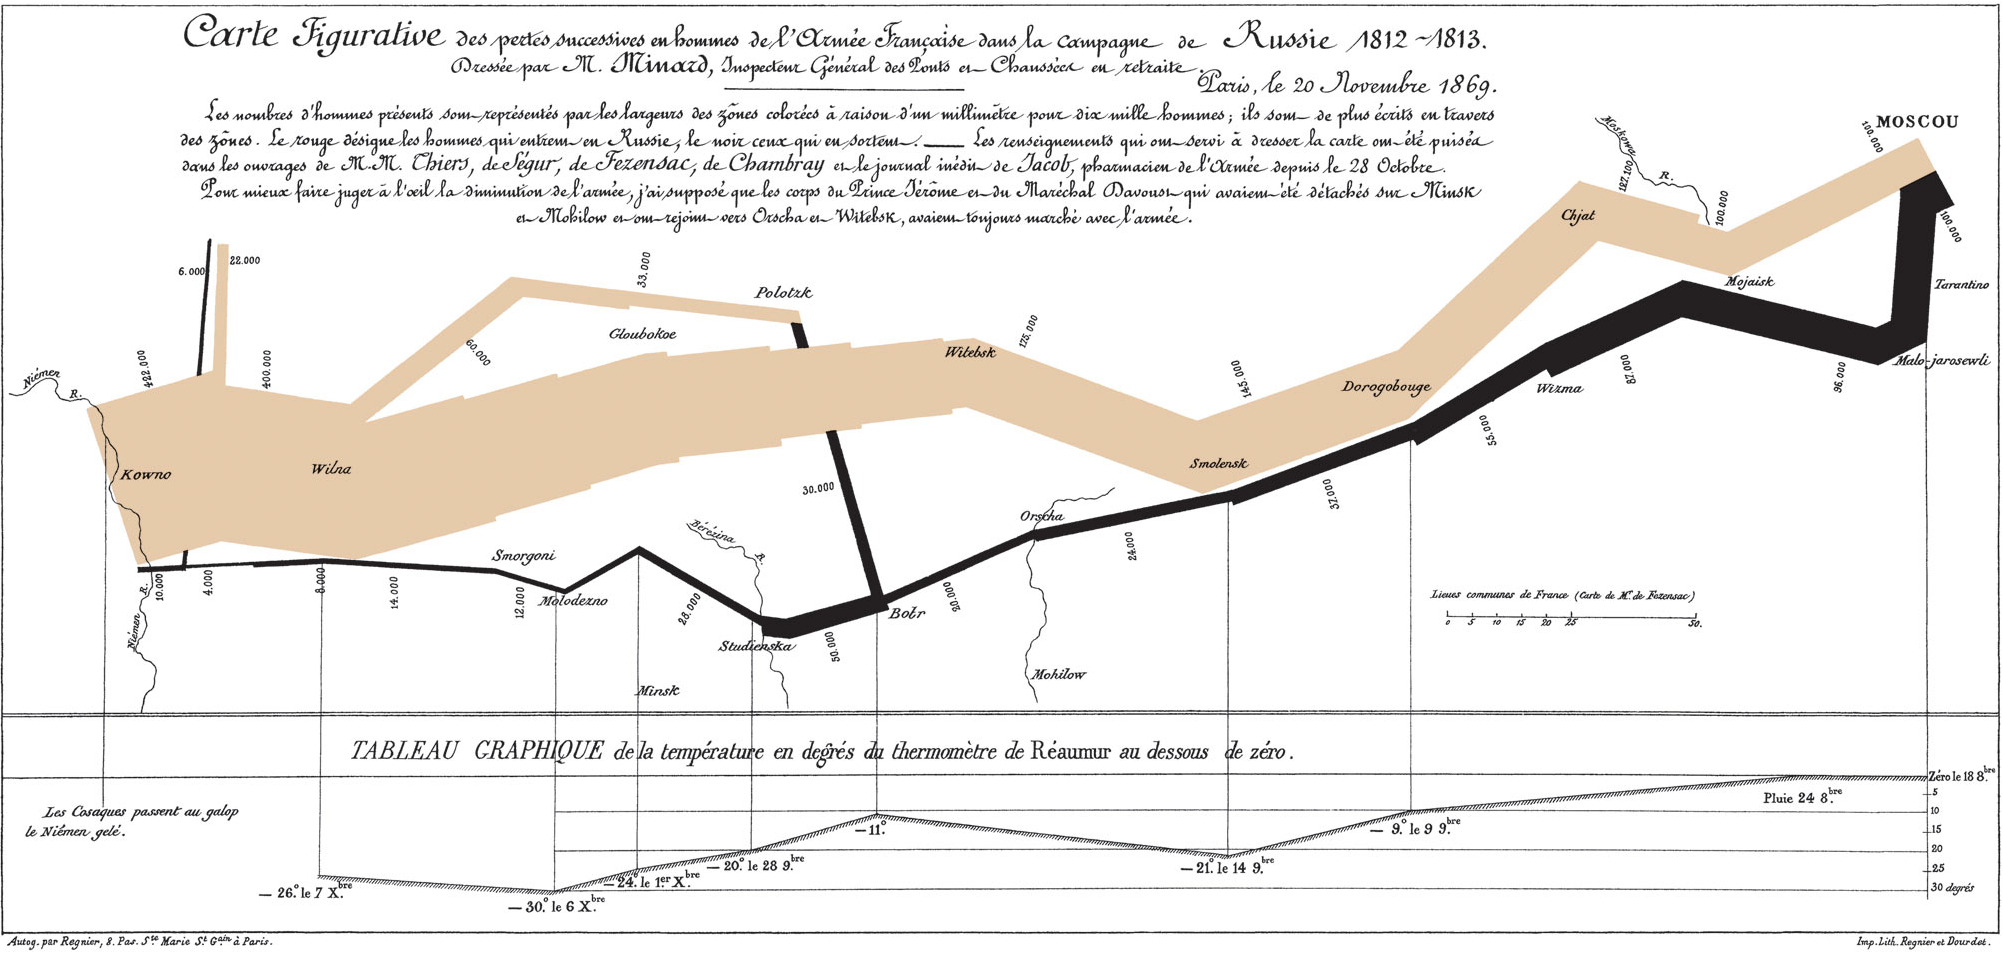
This infographic made by Charles Joseph Minard in 1869 is perhaps the most foundational to the modern field of data visualization. It is one of…
Read more1856 Crimean War- Nightingale
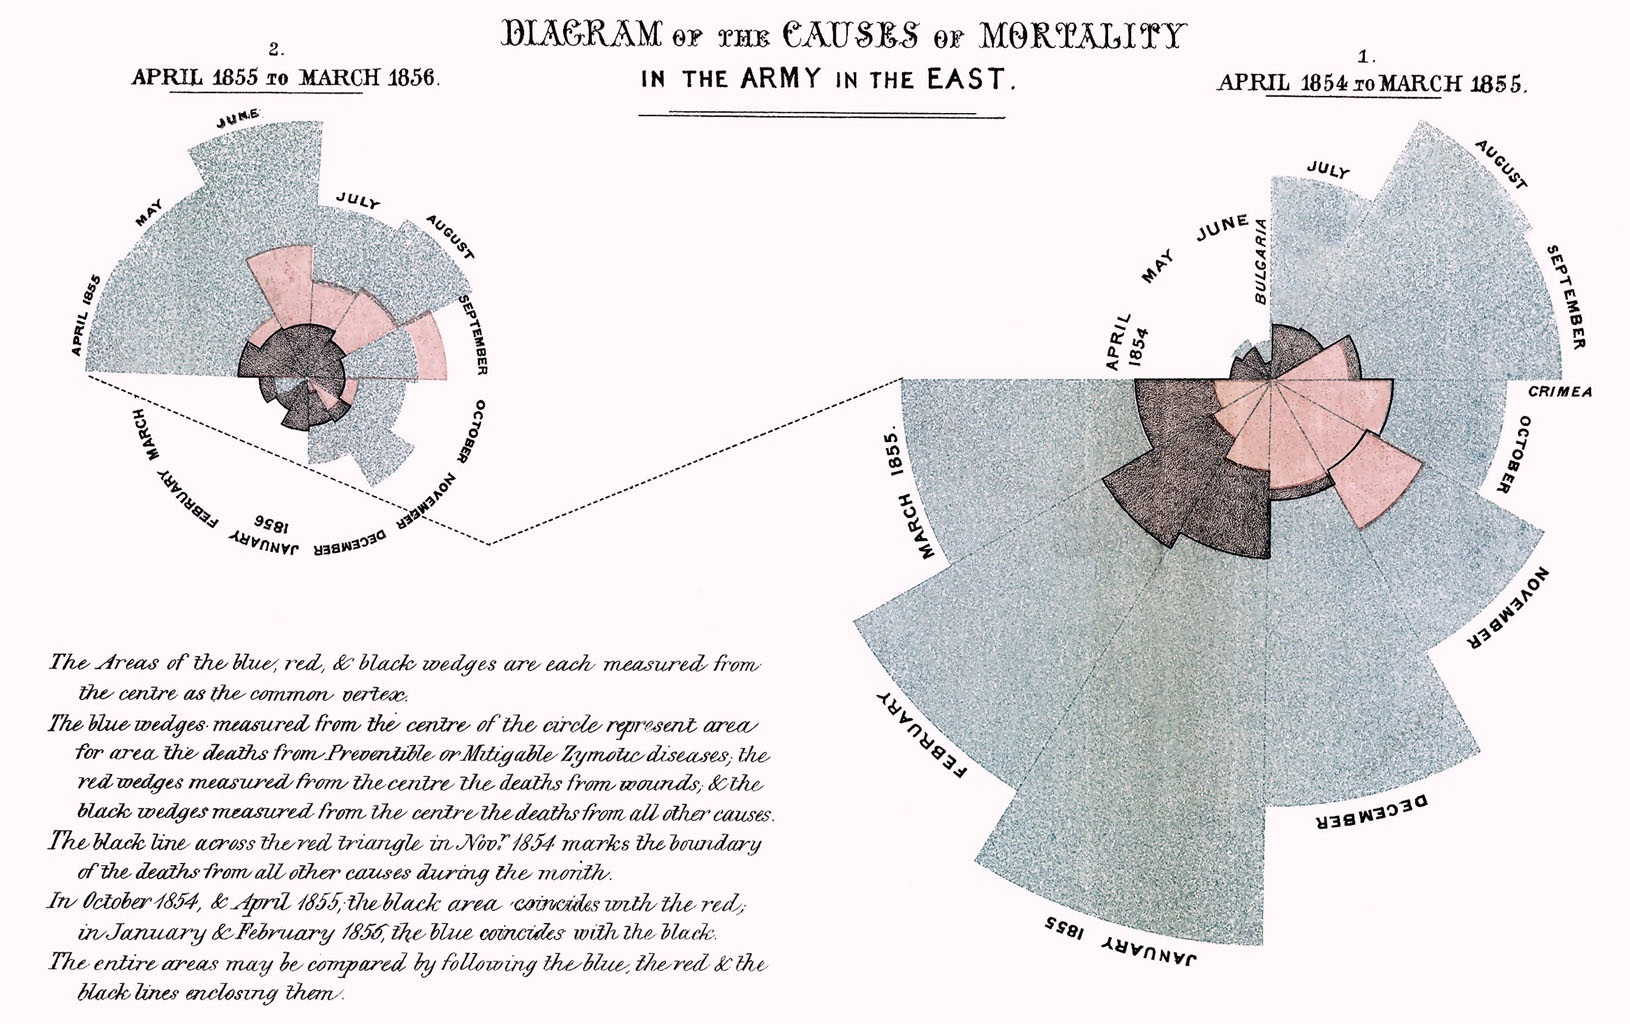
Florence Nightingale was a talented statistician trained from an early age by her father’s connections in the Cambridge mathematics department. She met legendary mathematician Charles…
Read more1885 Civil War – Scaife

‘History of the Civil War in the United States’ is a fascinating piece, as much for the ways in which it succeeds as for the…
Read more1885 Civil War – Rosen
This modern video timeline of the Civil War showcases some of the potential applications for introducing interactivity and responsiveness into conventional data visualization tools like…
Read more1918 World War I – D’Filippo
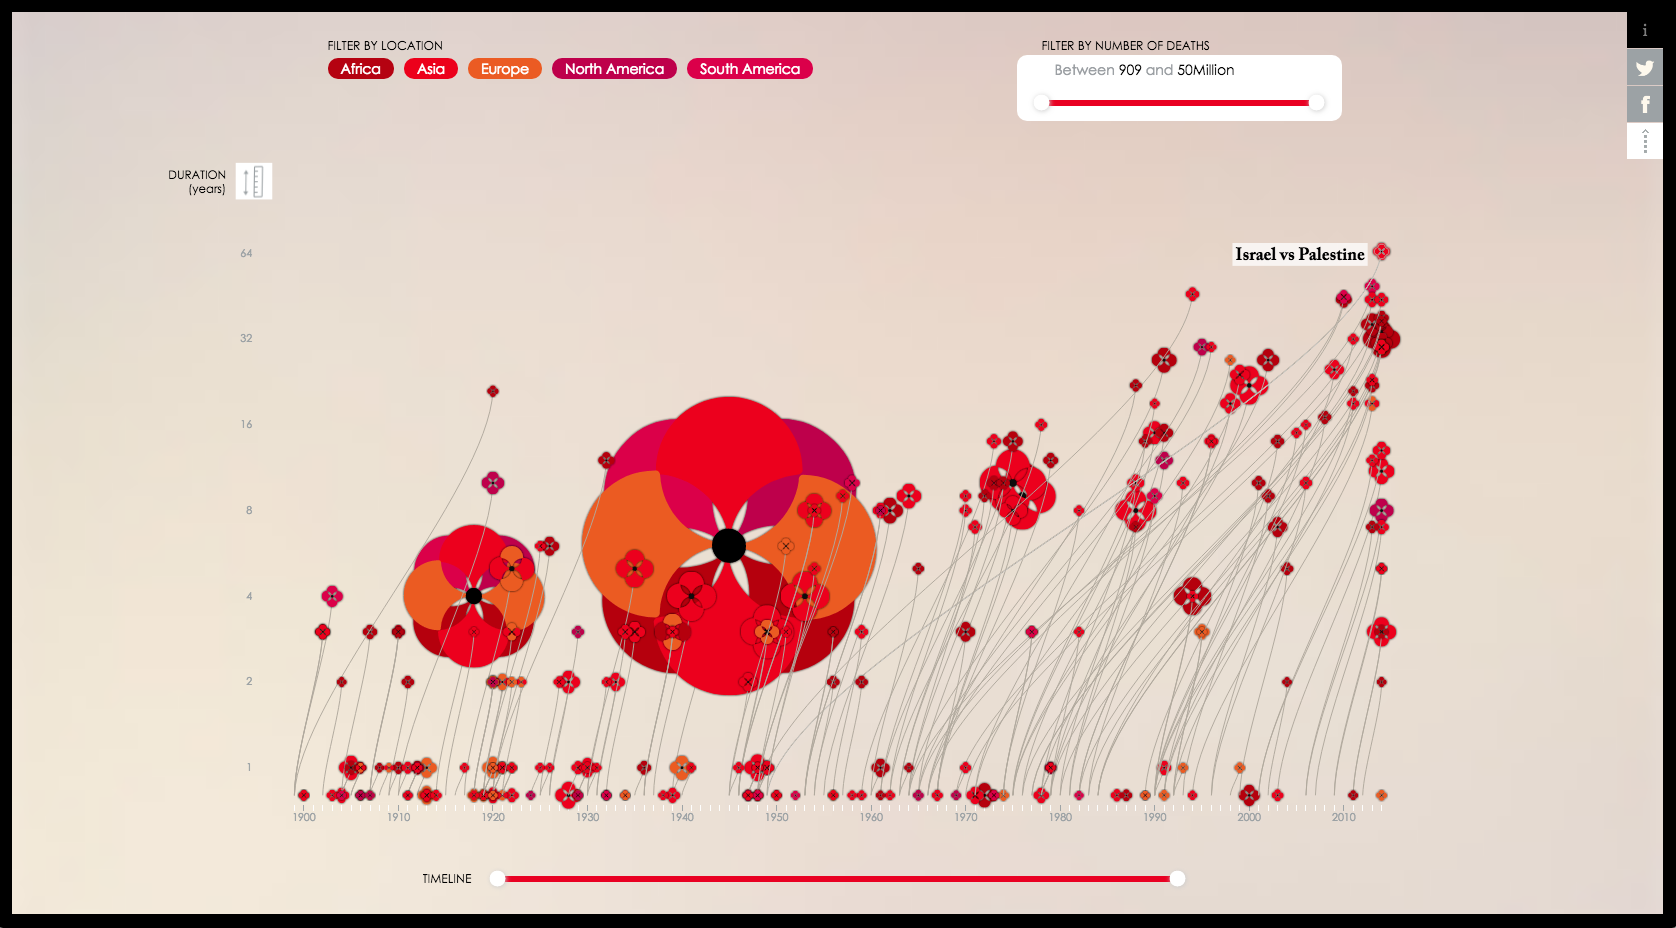
Valentina D’Efilippo’s interactive online data visualization ‘Poppy Field’ memorializes the dead of all of the conflicts from 1900-2014. However, it is framed around World War…
Read more1945 World War II – Halloran

Neil Halloran’s interactive video ‘The Fallen of World War II’ reimagines the data from the second World War in ways that are as fascinating and…
Read more1975 Vietnam War – Thomas
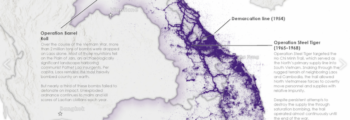
This 2016 infographic map of the Vietnam War uses Department of Defense declassified digital geographic data on bombings throughout the war to paint a haunting picture…
Read more2014 War in Afghanistan – Scruton/The Guardian
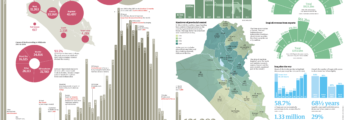
The Guardian has become known for its prolific and often masterful use of infographics. This piece by Paul Scruton deploys multiple visualization techniques ranging from…
Read more2014 War in Afghanistan – Bohannon/Brower
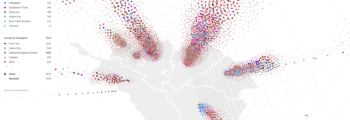
This piece from 2010 details the civilian casualties from the War in Afghanistan through an interactive plume graph produced for Science Magazine. A static version…
Read moreOngoing War with ISIS – Zotta
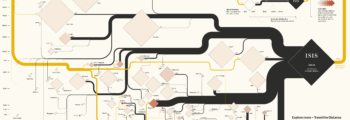
Alessandro Zotta’s 2017 piece ‘On Their Way’ beautifully dissects the path taken to (and from) the ranks of IS, showing the source countries and contextualizing…
Read more