Below are some prominent figures from the Saldanha Lab’s publications over the past 20 years.
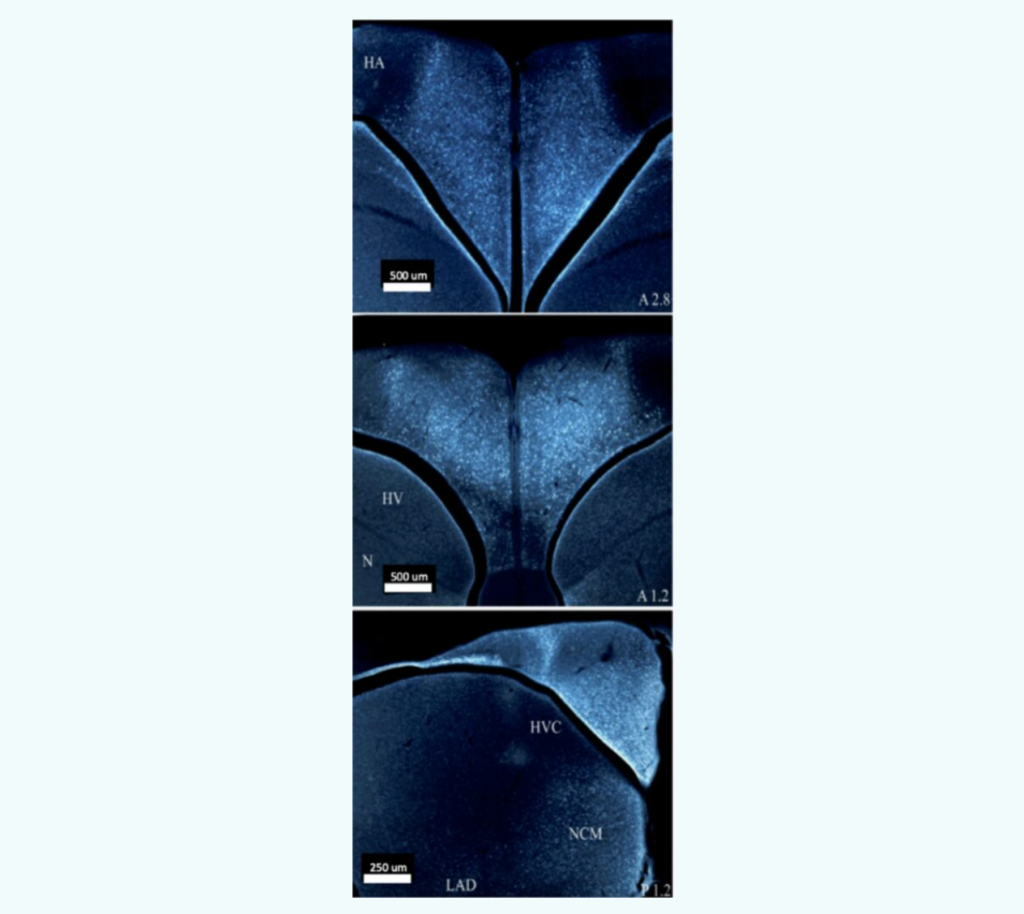
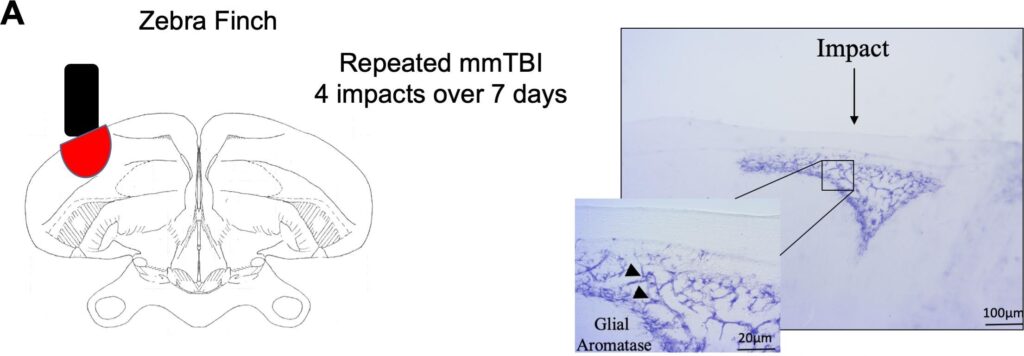
Saldanha et al., 2005 Two tags were used in this immunocytochemistry experiment. One tag was specific to aromatase (red) and one tag was specific to glial cells (green). The image above shows the red and green tagged images superimposed on each other, and the yellow is where the two overlap. All red areas contain some yellow, while there are some green areas that do not. This indicates that all aromatase-expressing cells are glial but not all glial cells express aromatase.Saldanha 2022 Pseudo-colored, contrast-enhanced, and sharpened photomicrographs depicting neuronal aromatase expression in pre- and post- synaptic boutons, as well as astroglia. Panel A depicts aromatase expression in neurons, B in terminals, and C in reactive astrocytes. Saldanha et al., 2011 Panel A is a low-power, pseudocolored image of aromatase expression in various brain areas of the black capped chickadee. Panel B shows a high-power photomicrograph of aromatase expression in the preoptic neurons in the adult zebra finch brain (brown). Panel C indicates that aromatase has abundant expression in the cytoplasm of cell bodies, but not neuronal nuclei (n) in adult zebra finches. Panel C is a Immunoelectronmicrograph which shows a presynaptic bouton which innervates a dendrite expressing aromatase in an adult male zebra finch. Schlinger et al., 2022 The light blue in these images shows aromatase expression in different brain areas of a male black-capped chickadee. There is a distinct presence of aromatase in the hippocampus and caudomedial nidopallium (NCM).Peterson et al., 2005 This figure shows aromatase expression in the hypothalamic preoptic area (HPOA) (A), caudomedial nidopallium (NCM) (B), hypothalamus (HP) (C), and the high vocal center (HVC) (D). In panels A and B arrows indicate where aromatase immunoproduct is visible along tracts of the rough ER (RER) but not the nucleus (N) or nucleolus (Nu). Aromatase expression (indicated by arrows) can also be seen in the presynaptic terminals in panels C and D. Bailey & Saldanha, 2015 Panel A shows the where the hippocampus (HP) is in the zebra finch brain. Panel B shows where the caudomedial nidopallium (NCM) is in the zebra finch brain. Panel C shows aromatase mRNA expression in the HP and panel D shows aromatase mRNA expression in the NCM. It can be seen that there is an abundance of aromatase mRNA expression, indicating the role of E2 in both spatial memory and auditory discrimination, respectively.Duncan & Saldanha, 2020 In this experiment, the zebra finch brain was mildly concussed over several days. The image on left shows where on the zebra finch brain injuries were applied. The image on the right shows the upregulation of glial aromatase (purple) due to the injuries. There is a noticeable increase in aromatase expressing glial cells around the injury site. Bailey et al., 2013 The average E2 concentration in plasma and different brain areas across treatment. ATD is an aromatase inhibitor, which is to say, it inhibits the synthesis of E2. SIL (silicone) is a control treatment. The plasma has the lowest concentration of E2 of all the measured areas. The Hippocampus (HP) has the highest E2 levels. ATD only significantly lowered E2 concentrations relative to SIL in the HP, not the caudomedial nidopallium (NCM) or diencephalon.Bailey et al., 2013 The above graph shows the mistakes birds made across treatment group in a spatial memory task. Birds in the ATD group received an ATD soaked pellet resting on their brain. Birds in the SIL group only received a silicone pellet on their brain (control). Birds in the LESION group received 0.1 μL of ibotenic acid in 0.1 M PBS injected into the HP. Birds in the SHAM group received only 0.1 μL of PBS injected into the HP (control). Birds in the CRANIOTOMY group remained under anesthesia for 5 minutes. Birds in both control groups, SIL and SHAM, had the lowest number of mistakes. There was no difference between SIL and SHAM birds. Birds in the ATD and LESION groups had the highest number of mistakes. There was no difference between ATD and LESION birds. This indicates that ATD has comparable effects to an entire hippocampal lesion.Wynne et al., 2007 Secondary degeneration refers to the damage that spreads from the primary site of injury over time, it peaks at 24 hours post injury. The secondary wave of degeneration following brain injury is depicted here. In this experiment, the hemispheres of the birds’ brain were severed and a shot of saline was injected into one side and a shot of fadrozole was injected into the other. Fadrozole is an aromatase inhibitor and saline is a control treatment. The birds were sacrificed at different time intervals and the second wave of degeneration was measured. The side injected with saline had no secondary wave of degeneration, whereas the side injected with fadrozole had a near perfect wave of secondary degeneration. This indicates the necessity of aromatase in injury.Saldanha et al., 2011 This cartoon illustrates the three different traditional forms of hormonal signaling. Endocrine signaling involves hormones being secreted into the vascular system and delivered to targets centimeters or meters away. Paracrine signaling involves hormones secreted into extracellular fluid and delivered to relatively close targets (typically in the same organ). Autocrine signaling involves a cell’s own hormone signaling activating itself. Synaptocrine signaling is our hypothesis of an alternative type of hormonal signaling that involves the synthesis of hormones in presynaptic boutons. The synaptocrine theory defines a type of neuromodulation wherein estrogens are shown to have regulated presynaptic synthesis and postsynaptic actions. This shifts the perception of estrogen from only being considered as a peripheral signal (as in the endocrine system) to include signaling systems intrinsic to the brain (synapses).