Pedagogy, Policy, and Practice
Connecting Course Repeats and Academic Alerts to Undergraduate Student Achievement
By Richard Laurberg and Bridget Trogden
Fall 2025
Introduction and questions
As leaders in the Office of Undergraduate Education and Academic Student Services (UEAS) at AU, we are ever immersed in problems, solutions, and initiatives relating to undergraduate student achievement. In our work, we seek to use institutional data on student learning to work with our AU community to improve our pedagogies, policies, and practices. But these measures can only take us so far. More substantive improvements to the student experience require connection between those focused on the macro-levels of education and those focused on the day-to-day educational experience.
In the past year, UEAS engaged multiple stakeholders (the Council on Undergraduate Education, Faculty Senate, Financial Aid, Undergraduate Associate Deans Council, Academic Advising Leadership, and others) on a few research questions. We were interested in knowing:
- What are the courses that are most repeated by undergraduate students? What are the repeat success rates of those students?
- What is the correlation between students’ final grades in courses and whether or not academic alerts are submitted by instructors?
- What are the reasons that instructors indicate on academic alerts that students are not successful?
Because this is The CTRL Beat, we wanted to write a short think piece for our teaching-focused colleagues, drawing on our research to outline practices they could adopt, in addition to current methods, to help improve student educational outcomes. The implications of the questions are not always straightforward, and we welcome our colleagues into continued discussion and dialogue.
Good teaching matters, but so does asking for help!
Faculty and instructors of record are experts in their subject matter and deploying evidence-based teaching practices to achieve student engagement and learning. We are both glad and impressed to see elements of emancipatory course design, antiracist teaching practices, alternative grading (CTRL, 2023b), and universal design for learning (CTRL, 2023a) pervasively in AU courses. The current college-going generation of students often faces high anxiety and shaky maturity for navigating the academic rigor of college, despite possessing high academic capabilities (Haidt, 2024). Approximately 1,600 students at AU are registered with ASAC for disability-related accommodations and learning support (1,200 undergraduate, 150 graduate, and 230 law from ’24-’25 numbers) and over 3,100 students use the services of the academic support unit yearly – including supplemental instruction, tutoring, writing center, math & stats lab, and academic coaching. In one-on-one meetings with academic staff, the main tasks that students ask for help with are time management, setting goals, creating action plans, breaking down assignments into manageable parts, and initiating tasks. While good teaching matters, having the ability for instructors to identify and point students to appropriate out-of-class support is also essential.
What have we learned from an analysis of the data?
Question 1. Repeated courses
Earlier this year, we undertook an investigation into repeated courses (i.e., courses that students took after earning a grade of “C–” or lower in their first attempt). In order to analyze the data efficiently, we narrowed our focus to the most repeated courses only, excluding courses that were allowable repeats in the catalog. Additionally, we limited our population to that of a single first-year academic cohort to allow us to examine repeat patterns across their total time at AU. With those parameters, we used the entering student cohort in fall 2020 as a test case: an adjusted fall cohort of 1,580 students, 71 percent of whom graduated by spring 2024 (Blanco et al., 2024). We considered only courses taken by 10 or more students as part of the fall 2020 first-year cohort and identified 18 relevant courses encompassing 875 course enrollment repetitions. All data was obtained via the MicroStrategy data platform, which draws from our central records database.
Table 1 shows the most-repeated courses for the test cohort. Of the 18 such courses, 11 are 100-level, 5 are 200-level, and 2 are 300-level. There are several groups of courses represented without any single group dominating the list: new student courses, economics, writing, research, and math/stats. Please note that identifying these courses does not in any way indicate that the courses are problematic; rather, courses that enroll the most students would rationally have the most students needing to repeat. As a result, we provided a third column to denote the total number of students who repeated the course, with the parenthetical numbers indicating the students taking advantage of a first repeat and a second repeat.
While over 90 percent of students are successful in a first attempt, the percentages of students passing typically fall upon later attempts at courses.
In all, most AU students successfully complete these courses. The average course GPA upon the aggregate student first attempt is included in the fourth column and, across the board, students are earning successful grades. Additionally, the percentage of students who are successful the first, second, and third time, respectively, is calculated and displayed in the columns to the right. While over 90 percent of students are successful in a first attempt, the percentages of students passing typically fall upon later attempts at courses, indicating that additional student academic support may be necessary to help students develop the strategies to overcome their reasons for academic struggle. The finding that increased course repeats connect to lower success rates is corroborated in literature studies of student academic disengagement upon academic struggle (Akos & James, 2020). While there may be multiple features of the repeating students that are impacting their success, the facts that they struggle more upon repeat is vital to point out.
Table 1. Courses Repeated by Ten or More Students, 2020F First-Year Student Cohort
| Course | Title | Students Repeating Total (1x,2x) | GPA 1st Attempt | % of Students Successful 1st Attempt | % of Students Successful 2nd Attempt | % of Students Successful 3rd Attempt |
|---|---|---|---|---|---|---|
| WRT-100 | College Writing | 47 (41, 6) | 3.47 | 96% | 76% | 17% |
| STAT-202 | Basic Statistics | 43 (40, 2) | 3.38 | 96% | 66% | 50% |
| CORE-200 | AU Experience II | 40 (34, 5) | 3.78 | 99% | 77% | 80% |
| WRT-101 | College Writing Seminar | 40 (37, 3) | 3.51 | 97% | 54% | 67% |
| CORE-105 | Complex Problems Seminar | 36 (34, 2) | 3.57 | 97% | 76% | 50% |
| ECON-200 | Microeconomics | 30 (27,3) | 3.37 | 95% | 85% | 67% |
| ECON-100 | Macroeconomics | 24 (20, 4) | 3.35 | 95% | 75% | 75% |
| GOVT-310 | Intro to Political Research | 23 (21, 1) | 3.38 | 94% | 81% | 0% |
| ECON-150 | Economics for Business | 16 (14, 2) | 3.12 | 93% | 100% | 100% |
| GOVT-105 | Indiv Freedom vs Auth | 15 (10, 5) | 3.25 | 94% | 100% | 60% |
| ACCT-240 | Principles of Financial Acct | 14 (12, 1) | 3.05 | 95% | 92% | 100% |
| CHEM-110 | General Chemistry I | 14 (11, 3) | 3.00 | 91% | 82% | 100% |
| CORE-100 | AU Experience I | 13 (13, 0) | 3.83 | 98% | 38% | n/a |
| SISU-105 | Intro to International Studies/World Politics | 13 (12, 1) | 3.44 | 96% | 67% | 0% |
| SISU-206 | Intro to Int’l Studies Rsrch | 12 (8, 2) | 3.28 | 93% | 75% | 50% |
| MATH-125 | The Math Workshop | 11 (9, 2) | 3.17 | 94% | 67% | 50% |
| MKTG-300 | Principles of Marketing | 11 (10, 1) | 3.27 | 99% | 100% | 100% |
| GOVT-130 | Comparative Politics | 10 (10, 0) | 3.46 | 95% | 90% | n/a |
Notes: This table excludes study abroad, internships, music and art performance, independent study courses, and courses with differing topics under the same course name. “Successful” denotes students earning a grade of “C” or higher. Five courses (STAT-202, CORE-200, GOVT-310, ACCT-240, SISU-206) had students in the cohort who repeated the course for a third time; these are excluded from the data owing to low numbers.
Question 2. Analyzing academic alerts
Nearly two-thirds of our students who received a non-passing grade may not have been alerted to their performance.
American University promotes an academic alert option whereby instructors can provide students with an alert at any time that their academic performance is subpar. Although instructors submit nearly 900 academic alerts per term on average, only 30 percent of the students who earn a D or F grade received an academic alert from their instructor, as depicted in Figure 1. This means that nearly two-thirds of our students who received a non-passing grade may not have been alerted to their performance and those supporting them (academic advisors, ASAC staff, College/School supports, cohort advisors, student-athlete success advisors, etc.) were unable to engage in proactive strategies to help them.

Figure 1. Prevalence of Academic Alerts within Ds and Fs Earned at AU
There may be multiple reasons that instructors do not submit academic alerts, but we do know that students are more successful when our community can support them and when those working with the students are aware of their needs for help. Accordingly, we are able to correlate the timing of academic alerts with final grade outcomes, as seen in Table 2. The takeaway is that among students who have received an academic alert, earlier academic alerts are correlated with higher grade outcomes. While 68 percent of students who receive an academic alert in the first third of a semester (weeks 1–6) earn a passing grade, only 52 percent of those who receive an academic alert in the last third of a semester (week 12+) do so. Early alertees’ GPAs (average 2.10) also end up being higher by over a half of a point compared to those of late alertees (average 1.57). An earlier academic alert could potentially allow a student to address their struggles, make a success plan, and improve.
Earlier academic alerts are correlated with higher grade outcomes.
Table 2. Degree-Seeking Full-Time Non-Transfer Undergraduates (Grade Outcomes by Percentage), 2023F–2024S
| Alert | Count | A | A– | B+ | B | B– | C+ | C | C– | D | F | W | Other | C or better | Course GPA |
|---|---|---|---|---|---|---|---|---|---|---|---|---|---|---|---|
| None | 63,425 | 52 | 17 | 9 | 8 | 4 | 2 | 3 | 1 | 1 | 1 | 1 | 1 | 95% | 3.47 |
| Any | 1,789 | 7 | 6 | 7 | 10 | 8 | 7 | 12 | 4 | 6 | 26 | 0 | 6 | 57% | 1.78 |
| Wk 1–6 | 408 | 8 | 8 | 9 | 11 | 7 | 9 | 16 | 4 | 8 | 17 | 0 | 3 | 68% | 2.10 |
| Wk 7–9 | 524 | 8 | 6 | 7 | 9 | 10 | 7 | 10 | 5 | 7 | 25 | 0 | 6 | 58% | 1.85 |
| Wk 10–11 | 399 | 7 | 5 | 5 | 10 | 9 | 7 | 10 | 4 | 5 | 34 | 0 | 5 | 52% | 1.63 |
| Wk 12+ | 458 | 5 | 4 | 7 | 10 | 8 | 7 | 11 | 3 | 5 | 29 | 0 | 11 | 52% | 1.57 |
Question 3. Information in academic alerts
Among the top 18 repeated courses from Table 1 for which academic alerts are submitted by instructors, the general category of “failure risk” was cited most widely as a reason for issuing the alert, included among academic alert reasons across all 18 courses. As seen in Figure 2, the other reasons in the alerts account for why the students are at risk of failure. Missing assignments is the second-most widespread reason (included as an academic alert reason in 78% of the courses), followed by excessive absences (44%), low test scores (28%), and poor student work on assignments (22%).
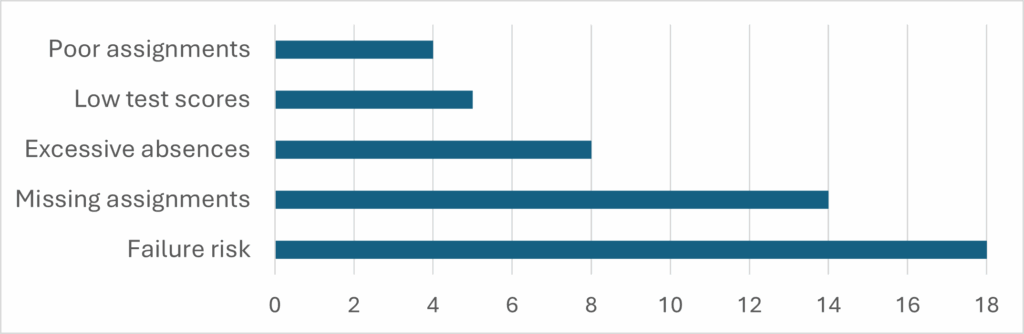
Figure 2. Primary Reasons for Academic Alerts Among the Top Repeated Courses at AU
Notwithstanding students’ high capability, they sometimes struggle with their day-to-day decisions and time management. While students’ submitted work (assignments and tests) are not a primary cause for concern, their absences and missing assignments are. It is also worth noting that the other academic alert categories may be caused or exacerbated by student absences from class. Distinguishing immediate causes and root causes is beyond the scope of this article, but class attendance remains one of the best predictors of student grade performance (Credé et al., 2010).
Notwithstanding students’ high capability, they sometimes struggle with their day-to-day decisions and time management.
Implications for teaching and academic support
Connecting back to the theme of pedagogy, policy, and practice, what can instructors do to support students who are on the margins? Multiple opportunities exist, and we list a few thoughts below:
- Design courses so that you are providing students with feedback early and regularly. Multiple lower-stakes assignments are better than fewer high-stakes assignments, especially in first-year courses or gateway courses to the major. Submit academic alerts early when students earn low grades or when their academic performance is otherwise unsatisfactory.
- Create opportunities for students to engage with you and their peers regularly in class. When students know that others are counting on them, they are more likely to attend class and be active participants.
- Teach students how to learn successfully for the courses you teach (McGuire, 2015). Provide explicit instructions on how to use textbooks or learning materials and seek out additional resources. Provide them with information on what, how, and how much out-of-class work you expect in the course. In this way, you are explaining the “hidden curriculum” to the students in more transparent ways (CTRL, 2023c).
- When you use high-stakes assignments, design them with multiple components or check-ins so that students can get feedback and pace themselves in completing summative work.
- Provide information to students about ASAC resources and multiple academic tools that are available to them. Normalize help-seeking behavior in your interactions with students.
- Seek out opportunities to work with other faculty at AU, through CTRL workshops, faculty learning communities, and convenings with AU Core and your academic departments.
In presenting this data, we aim to reinforce the vital role that AU faculty play in strengthening student academic success and feeling supported in their work. As you read this article and have additional research questions for us or thoughts you want to ponder, reach out! We welcome continued opportunities for collective work and improvements.
Author Profile
Richard Laurberg is Senior Coordinator of Undergraduate Education Assessment in the Office of Undergraduate Education & Academic Student Services (UEAS) at AU. He has worked at AU since 2013 and is instrumental in undergraduate student onboarding, retention, and graduation work.
Bridget Trogden is Dean of UEAS at AU and Professor of Education in SOE. She holds a PhD in chemistry and has served in faculty and academic leadership roles for the past two decades. As a scholar, she studies educational strategies for equitable student achievement and degree attainment.
References and Further Reading
Akos, P., and James, S. (2020). Are course withdrawals a useful student success strategy? NACADA Journal, 40(1), 80–93.
Blanco, M., Beads, R., Kaib, D., and Gibson, K. (2024). Academic data reference book. American University.
Credé, M., Roch, S. G., and Kieszczynka, U. M. (2010). Class attendance in college: A meta-analytic review of the relationship of class attendance with grades and student characteristics. Review of Educational Research, 80(2), 272–295.
CTRL. (2023a). Accessible course design: Universal design for learning. American University.
CTRL. (2023b). Alternative grading methods. American University.
CTRL. (2023c). The hidden curriculum: Helping students learn the “secret” keys to success. American University.
Haidt, J. (2024). The anxious generation: How the great rewiring of childhood Is causing an epidemic of mental illness. Penguin Press.
McGuire, S. Y. (2015). Teach students how to learn: Strategies you can incorporate into any course to improve student metacognition, study skills, and motivation. Stylus Publishing.
Shields, D. (2023). Predicting academic difficulty among first-semester college students. Journal of College Orientation, Transition, and Retention, 30(1).